

For more information about Mapping Lung Cancer, contact the Forum:
National Minority Quality Forum is solely responsible for the content of all information presented.
About the Index
The National Minority Quality Forum has launched the Lung Cancer Index to help health-care practitioners, policy makers, advocacy groups, and industry identify and quantify lung cancer by race/ethnicity, age, and gender.
This internet-based resource enables users to map lung cancer prevalence and total counts at the zip-code level for the United States as well as for individual states, and federal and state legislative districts.
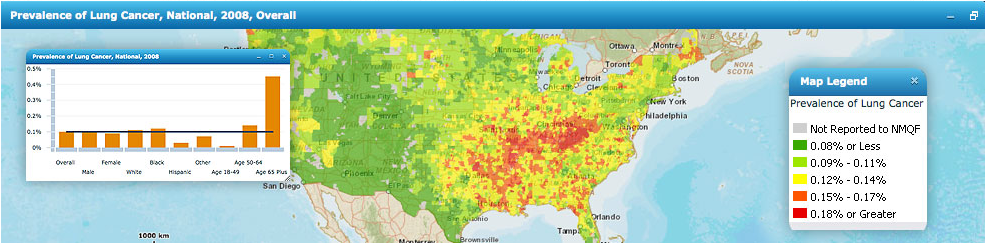
In addition to mapping lung cancer prevalence overall, the index maps lung cancer by age, gender, and race/ethnicity. Lung Cancer Index users may generate color-coded maps of lung cancer prevalence for downloading, printing, and dissemination to support educational and advocacy initiatives.

Mapping Lung Cancer provides a comprehensive array of maps about the prevalence and total counts of lung cancer at the zip-code level for the United States, as well as for individual states, and federal and state legislative districts.
Traveling the Lung Cancer Index will allow you to generate color-coded maps for downloading, printing, and dissemination to support your educational and advocacy initiatives.
Methodology
Introduction
We estimated County prevalence of lung cancer by the demographic categories of age, sex and race/ethnicity using a common factor spatial model[1][2]. We then applied the county prevalence estimates to Zip Code demographics from U.S. Census 2000[3] and U.S. Census 2010[4] to estimate prevalence of lung cancer at that level.
Method
County Prevalence of Lung Cancer
County estimates of lung cancer prevalence were calculated by multiplying the national lung cancer prevalence rates with the relative risk estimates of lung cancer in a county, see equation 1 below:
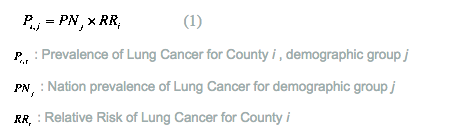
The national lung cancer rates by age, race and sex are obtained from National Cancer Institute’s Surveillance Epidemiology and End Results Program[5] (SSEER). The year of national rates used in this project is from 2006 and 2008.
Estimation of county relative risk of lung cancer is based on a common factor spatial model. This model uses three observed indicators to develop a county level relative risk morbidity index of lung cancer. The US wide relative risk is 1, high morbidity counties have high relative risks (significantly above 1), and low morbidity counties have low relative risks (significantly below 1). The lung cancer relative risk model uses county level lung cancer mortality for 2004-2008 [6], and county lung cancer incidence 2004-2008 [7]. It also incorporates the effect on lung cancer of county poverty and county smoking rates.
For technical details of the common factor spatial model, readers may refer to the papers of “Generalized common spatial factor model” by Wang and Wall [1], and “The need for psychiatric care in England: a spatial factor methodology” by Congdon [2].
Zip Code prevalence of Lung Cancer
Zip Code prevalence within each county for the demographic categories (e.g., “All Males”, “Black”, “Age 65 and over”) was calculated based on age/sex/race population structure of the Zip Code (population data between the Census years were estimated from combining Census 2000[3] and Census 2010[4] information) and the county level prevalence estimates. For example, Zip Codes which are located in a high prevalence county and have a larger than average share of the blacks in the total male population, will have a high overall lung cancer prevalence rate for “All Males”, given that black males have a relative high lung cancer prevalence than other races nation-wide. The same principle applies to age structure: the US prevalence rates are higher for people over 65, so Zip Codes with higher than average proportions of old people will have higher “Overall” rates, especially when the county morbidity relative risk is high.
We also calculated the total number of lung cancer cases at Zip Code by multiplying Zip Code population with the estimated “Overall” lung cancer prevalence for the Zip Code.
Mapping
The national maps of lung cancer prevalence and total number of cases were created with ArcMap. Values were classified by the natural-breaks (Jenks) method, which identifies break points by creating the breaks that best group similar values and maximizes the differences between levels [8].
References
- Wang and Wall, 2003, “Generalized common spatial factor model”, Biostatistics, 4: 569-582.
- Congdon, 2008, “The need for psychiatric care in England: a spatial factor methodology”, Journal of Geographical Systems 10, 217-239.
- US Census Bureau, Census 2000, Summary File 1, prepared by US Census Bureau, 2001.
- US Census Bureau, Census 2010, Summary File 1, prepared by US Census Bureau, 2010, http://www2.census.gov/census_2010/04-Summary_File_1/ (accessed December 2011).
- SEER Cancer Statistics Review, http://seer.cancer.gov/csr/1975_2008/ (accessed May 2012).
- CDC Compressed Mortality File http://wonder.cdc.gov/mortsql.html (accessed May 2012).
- State Cancer Profiles http://statecancerprofiles.cancer.gov/ (accessed May 2012).
- ESRI Support Center, “Natural Breaks (Jenks),” in ArcGIS 9.2 Desktop Help, http://webhelp.esri.com/arcgisdesktop/9.2/index.cfm?topicname=natural_breaks_%28jenks%29.